
11 min read

The ability to create and customize KPIs tailored to your individual role allows businesses to change and adapt effectively.
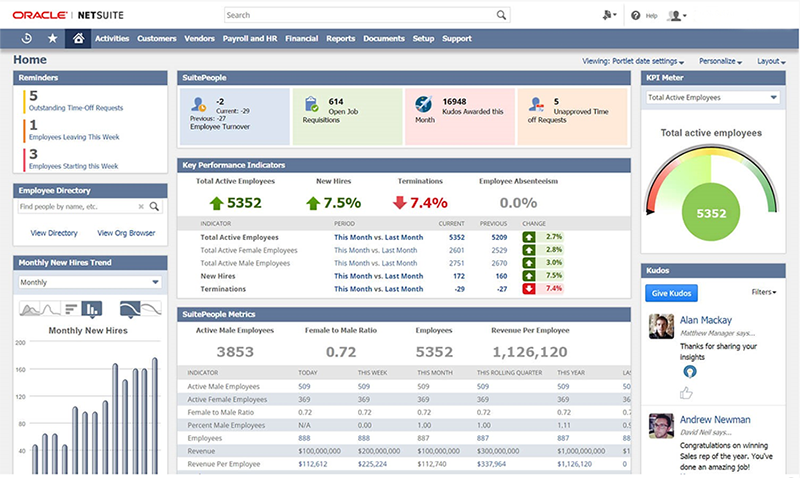
One of the most significant components of NetSuite is the ability to have a real-time, 360 view of your business on a single dashboard. Visibility is critical to understanding your business, increasing efficiency, and distinguishing the areas that need to improve. NetSuite Key Performance Indicators present just that…an overview of your need-to-know business data, with drill-down capabilities.
This tips guide reveals the important steps to create, edit, and manage KPIs based on your individual business requirements.
CUSTOM KPIs
NetSuite offers 75 out-of-the-box KPIs that can appear in your dashboard’s KPI portlet. These standard report figures permit you to drill down into the complete report for further information and detail when needed. But in most situations, businesses have specific data that they need to display that is not available in NetSuite’s standard reporting.
In such a case, users have the ability to establish a new saved search or utilize an existing saved search that is consistent with this data.
Establishing a NEW Search to be a custom KPI
Follow the steps to generate a new saved search to be utilized as a custom KPI:
1. Go to: Lists > Search > Saved Searches (Admin) > New.• Make sure that date filters are not used. KPIs are unable to implement summary criteria filters in groupings, which may result in different information from the original saved search.
• To display a counted number of search outputs for a single KPI choose the ID field (Number) and determine a Count summary type.
• To reveal summary data like maximum, total amount, average, or minimum, choose a field and select its summary type.
You can utilize your search as a custom KPI and add it to the KPI scorecard, KPI portlet, or set it to appear in a trend graph portlet.
Utilizing an EXISTING Search to be a custom KPI
Follow the steps to modify a custom KPI by editing an existing saved search:
1. Go to: Lists > Search > Saved Searches.• To display a counted number of search outputs for a single KPI choose the ID field (Number) and determine a Count summary type.
• To reveal summary data like maximum, total amount, average, or minimum, choose a field and select its summary type.
• If you run into an editing issue and cannot resave a search, create an equivalent search or ask the previous owner to alter it. Select Save & Run to confirm that the results are accurate.
NetSuite gives users the ability to display 1-10 custom KPIs in each portlet with drill down results from its saved search.

How to add custom KPIs to the KPI Portlet
1. Inside the KPI portlet select Set Up.Fun fact: Custom KPIS are displayed with a c icon.
#3-6 apply for every selected KPI:
3. Inside the Range list choose a date range that you would like the data included.Utilizing Custom KPIs in a KPI Scorecard
A Key Performance Scorecard reveals comparative research amongst numerous KPIs through several date timelines or accounting periods. Identify ten custom KPIs to be calculated in each KPI scorecard portlet.
Follow the steps to learn how to add a custom KPI to a KPI scorecard:
1. Select the KPI scorecard to which you would like to add a custom KPI.
• Editing a KPI scorecard: Head to Customization > Centers and Tabs > KPI Scorecards (Admin) and select Edit on the scorecard you would like to modify.
• Creating a KPI scorecard: Head to Customization > Centers and Tabs > KPI Scorecards > New (Admin).
KPI METER PORTLETS
Every KPI meter displays visuals that correspond to KPI data in the dashboards KPI portlet for a single date range, two date ranges or an indicated threshold amount. NetSuite allows you to display up to 3 Key Performance Indicator meter portlets in a dashboard. KPI choices for a meter include Actual vs Forecast, Forecast vs Quota / Alt. Sales, and Actual vs Quota.
How to set up a KPI meter portlet
1. Before you start, ensure that your KPI meter that you would like to expose is listed in the KPI portlet. Not listed? Select Set up in the portlet menu > Add Standard KPIs / Add Custom KPIs, choose the KPI, and click Done.• Actual vs. Forecast meter you must add Sales, Forecast (Alt. Sales) to the KPI Portlet
• Forecast vs. Quota (Alt. Sales) meter you must add Forecast (Alt. Sales), Quota (Alt. Sales)
• Actual vs. Quota meter you must add Sales, Quota
• Forecast vs. Quota meter you must add Forecast (Alt. Sales), Quota
To include these KPIs in the portlet, Go to Set Up > Add Standard KPIs > Select the desired KPIs > Done and Save.
1. To modify the KPI meter set up for range, threshold, and highlights select Set up, edit the items, and Save. NetSuite also allows you to download or print KPI meters by clicking on the three circles on top right of the portlet menu.How to Set up Trend Graph Portlets
NetSuite allows you to add 5 trend graph portlets to a page and set display possibilities for up to 3 Key Performance Indicators. Each trend graph portlet incorporates the option to download, export to a CSV file or print for your records.
1. In the Settings, portlet click the Personalize link.Check out our recent blog post recapping the latest and greatest updates for 2023.1.
9. Click Save and the trend graph will refresh itself.In order for a saved search to be utilized as a custom KPI that reviles performance for numerous date ranges in the KPI Portlet, scorecard, meter, or trend graph, the search definition must meet these terms:
- The saved search does not incorporate date fields that are specified as filters on the Criteria subtab.
- Must have only one field with a count, group or sum on the results subtab and summary type.
- Date field must be identified as an available filter.
NetSuite Tips & Tricks
Protelo offers many different resources to make using and customizing NetSuite a breeze. Here are a few to get you started:
1. On-Demand NetSuite Support Services
2. NetSuite Global Search Tips
3. NetSuite How To: Import Online Bank Data & Auto Match Transactions
4. Customizations In NetSuite: What To Know
5. NetSuite Tip: Creating Custom Fields In NetSuite
6. NetSuite Inbound Shipping: An Explainer
Protelo is a NetSuite reseller and has an experienced IT team with over 20 years in the software industry.
Got a NetSuite Question? Need help with NetSuite? Let’s talk! Protelo’s expert consultants have the Suite answer!
No contracts for services & troubleshooting, no minimums… If you have a NetSuite question, shoot us a line. Check out our extensive NetSuite services list. Our senior team of experienced NetSuite consultants is available and happy to assist right away. We work on-demand, when you need us. No long-term commitments or retainers.
Follow us on Social for NetSuite tips, tricks, and ERP fun:
YouTube, LinkedIn, X, Pinterest, Instagram, and Facebook